

P values are so ubiquitous in clinical research that it’s easy to take for granted that they are being understood and interpreted correctly. After all, one might say, they are just simple proportions and it’s not brain surgery. At times, however, it’s the simplest of things that are easiest to overlook. In fact, the definitions and interpretations of p values are sufficiently subtle that even a minute pivot from an exact definition can lead to interpretations that are wildly misleading.
In the case of clinical trials, p values have a momentous impact on decision-making in terms of whether or not to pursue and invest further into the development and marketing of a given therapeutic. In the context of clinical practice, p values drive treatment decisions for patients as they essentially form the foundational evidence upon which these decisions are made. This is perhaps as it should be, as long as the definition of p values and their interpretations are sound.
A counter-point to this is the bias towards publishing only studies with a statistically significant p value, as well as the fact that many studies are not sufficiently reproducible or reproduced. This leaves clinicians with an impression that evidence for a given treatment is stronger than the full picture would suggest. This, however, is a publishing issue rather than an issue of significance tests themselves. This article focuses on interpretation issues only.
As p values apply to the interpretation of both parametric and non-parametric tests in much the same way, this article will focus on parametric examples.
Interpreting p values in superiority/difference study designs
This refers to studies where we are seeking to find a difference between two treatment groups or between a single group measured at two time points. In this case, the null hypothesis is that there is no difference between the two treatment groups or no effect of the treatment, as the case may be.
According to the significance testing framework, all p values are calculated based upon an assumption that the null hypothesis is true. If a study yields a p value of 0.05, this means that we would expect to see a difference between the two groups at least as extreme as the observed effect 5% of the time if the study were to be repeated. In other words, if there is no true difference between the two treatment groups and we ran the experiment 20 times on 20 independent samples from the same population, we would expect to see a result this extreme once out of the 20 times.
This, of course, is not a very helpful way of looking at things if our goal is to make a statement about treatment effectiveness. The inverse likely makes more intuitive sense: if we were to run this study 20 times on distinct patient samples from the same population, 19 out of 20 times we would not expect a result this extreme if there was no true effect. Based on the rarity of the observed effect, we reject the null hypothesis as the working explanation of the data and proceed as though a difference between the two treatments exists. This is a decision rule, not a statement about how probable either hypothesis is. As the p value does not tell us whether the difference is in a positive or negative direction, care should of course be taken to confirm which of the treatments holds the advantage.
P values in non-inferiority or equivalence studies
In non-inferiority and equivalence studies, the hypothesis structure is flipped. The null hypothesis assumes that the new treatment is worse than the standard treatment by at least a pre-specified margin, δ. This margin must be defined before the study begins. Therefore, to prove non-inferiority, we actually want to see a statistically significant p value (e.g., p < 0.05) to reject this null hypothesis of inferiority.
The interpretation of the p value remains tied to the assumption of the null hypothesis, but the implications are different. In these types of studies, it is ideal for the confidence intervals for the individual treatment effects to be narrow, as this provides certainty that the estimates obtained are accurate in the absence of a statistically significant difference between the two estimates.
What p values do not tell you
A p value of 0.05 is not the same as saying that there is only a 5% chance that the treatment won’t work. Whether or not the treatment works in the individual is another probability entirely. It is also not the same as saying there is a 5% chance of the null hypothesis being true. The p value is a statistic that is based on the assumption that the null hypothesis is true and, on that basis, gives the likelihood of the observed result.
Nor does the p value represent the chance of making a Type I error. As each repetition of the same experiment produces a different p value, it does not make sense to characterise the p value as the chance of incorrectly rejecting the null hypothesis (i.e., making a Type I error). Instead, an alpha cut-off point of 0.05 should be seen as indicating a result rare enough under the null hypothesis that we are now willing to reject the null as the most likely explanation given the data. Under a Type I error alpha of 0.05, this decision is expected to be wrong 5% of the time, regardless of the specific p value achieved in the statistical test. The relationship between the critical alpha and statistical power is illustrated below.
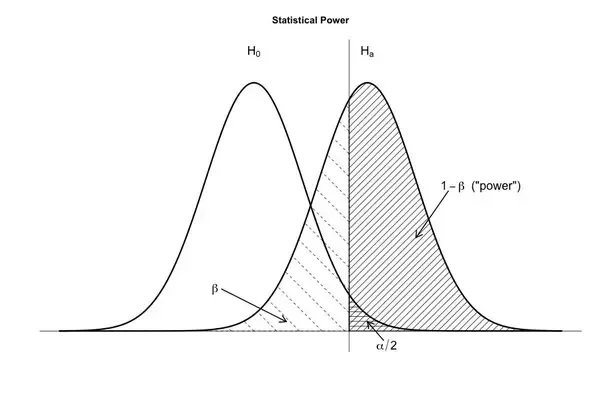
Another misconception is that a small p value provides strong support for a given research hypothesis. In reality, a small p value does not necessarily translate to a big effect, nor a clinically meaningful one. The p value indicates a statistically significant result; however, it says nothing about the magnitude of the effect or whether this result is clinically meaningful in the context of the study. A p value of 0.00001 may appear to be a very satisfactory result; however, if the difference observed between the two groups is very small, then this is not always the case. All it would be saying is that “we are really, really sure that there is only a minimal difference between the two treatments”, which in a superiority design may not be as desired.
Minimally important difference (MID)
This is where the importance of pre-defining a minimally important difference (MID) becomes evident. The MID, or clinically meaningful difference, should be defined and quantified in the design stage before the study is to be undertaken. In the case of clinical studies, this should generally be done in consultation with the clinician or disease expert concerned.
The MID may take different forms depending on whether a study is a superiority design versus an equivalence or non-inferiority design. In the case of a superiority design, or where the goal of the study is to detect a difference, the MID is the threshold of minimum difference at which we would be willing to consider the new treatment worth pursuing over the standard treatment or control. In the case of a non-inferiority design, the MID would be the minimum lower threshold at which we would still consider the new treatment as equally effective or useful as the standard treatment. Equivalence design, on the other hand, may sometimes rely on an interval around the standard treatment effect.
When interpreting results of clinical studies, it is of primary importance to keep a clinically meaningful difference in mind, rather than defaulting to the p value in isolation. In cases where the p value is statistically significant, it is important to ask whether the difference between comparison groups is also as large as the MID or larger.
Confidence Intervals
All statistical tests that involve p values can produce a corresponding confidence interval for the estimates. Unlike p values, confidence intervals do not rely on an assumption of the null hypothesis but rather on the assumption that the sample approximates the population of interest. A common estimate in clinical trials where confidence intervals become important is the treatment effect. Very often this translates to the difference in means of a surrogate endpoint between two groups; however, confidence intervals are also important to consider for individual group means/treatment effects, which are an estimate of the population means of the endpoint in these distinct groups.
Confidence interval for the mean A 95%
A 95% confidence interval indicates that if the study were to be repeated many times, 95% of the calculated intervals would contain the true, fixed population mean. While this estimate is based on the real mean of the study sample, our interest remains in making inferences about the wider population who might later be subject to this treatment. Thus, inferentially, the observed mean and its confidence interval are both considered an estimate of the population values.
In a nutshell, the confidence interval indicates how sure we can be of the accuracy of the estimate. A narrower interval indicates greater confidence and a wider interval less.
Confidence interval for the mean difference, treatment effects or difference in treatment effects
The mean difference in treatment effect between two groups is an important estimate in any comparison study, from superiority to non-inferiority clinical trial designs. Treatment response is mainly ascertained from repeated measures of surrogate endpoint data on the individual level. One form of mean difference is repeated measures data from the same individuals at different time points; these individuals’ differences could then be compared between two independent treatment groups. In the context of clinical trials, confidence intervals of the mean difference can relate to an individual’s treatment effect or to group differences in treatment effects.
A 95% confidence interval of the mean difference in treatment effect indicates that, if this study were to be repeated many times, 95% of the calculated intervals would contain the true difference in treatment effect between the groups. A confidence interval containing zero indicates that a statistically significant difference between the two groups has not been found. Namely, if part of the interval falls above zero on the number line and part of the interval falls below zero, indicating a difference in the opposite direction, we cannot be sure whether one group is truly higher or lower than the other.
Much ho-hum has been made of p values in recent years but they are here to stay. While alternatives to p values exist, such as Bayesian methods, these statistics have limitations of their own and are subject to the same propensity for misuse and misinterpretation as frequentist statistics are. Thus it remains important to take caution in interpreting all statistical results.
References :
Gao, P-Values – A chronic conundrum, BMC Medical Research Methodology (2020), 20:167
https://doi.org/10.1186/s12874-020-01051-6
The Royal College of Ophthalmologists, The clinician’s guide to p values, confidence intervals, and magnitude of effects, Eye (2022) 36:341–342; https://doi.org/10.1038/s41433-021-01863-w
